Essential Excel Concepts: Data Tables
- markbraxtondata
- Sep 8, 2024
- 1 min read
When we export external data into Excel, the first thing we should do is create a table. The reason is because tables have built-in capabilities that are powerful for data analysis.
Some of the built-in features include automatic formatting, automatic fill, filtering, sorting, and automatic named ranges (to name a few).
In this blog, we will first discuss how to create a table.
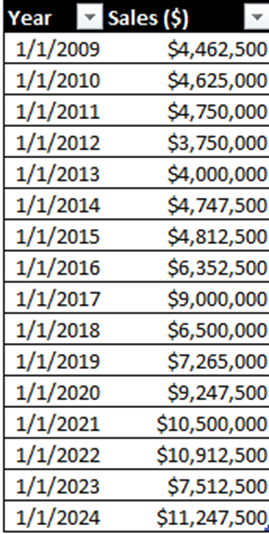
Here is our data from Excel.

As you can see, it looks a bit bland and hard to decipher. By selecting the entire dataset, we can create a table by going to the Home tab and clicking on Format as Table.

You will notice many choices of colors when selecting a theme for our table. Here I will choose the blue theme.

You will be prompted with a pop-up if you table has headers. Our table does, so we select OK.

Now we have a table.

You could also have used a shortcut to create a table as well—control + t after selecting your entire data range.
I also use another command shortcut ALT + H + O + I that auto-formats the column width as shown below.

Now we can use the built-in sorting to sort our data in Ascending Order by clicking the drop-down arrow like we used a lot in Blog #1: Data Cleaning.

We can also use filtering that is built-in tables. Here we only want to view the East location, so we will check the East location option in the selection box.


Comments