Essential Excel Concepts: Data Analysis
- markbraxtondata
- Sep 8, 2024
- 4 min read
The reason to learn Excel is to perform data analysis. I know there are other reasons too. However, it all comes down to trying to extract meaningful information from your dataset that you can action on.
Whether the action is summarizing results to set goals moving forward or comparing top performers in key regions to award bonus/incentives, data analysis is at the heart of each endeavor.
I will walk through an exercise to help build your data analysis muscle (muscles?) in a common business exercise where analysis sales results to track top performers and locations.
Let us first learn more about the dataset. We need to truly understand our data to be able to make meaningful conclusions.

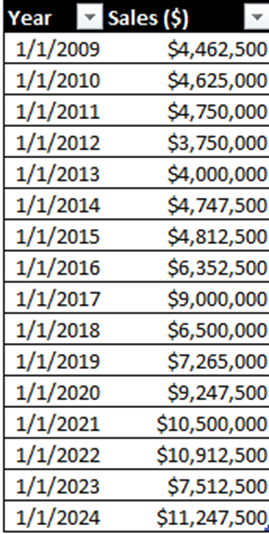
In this data set, we have data for employee sales. We are given Location, Hire Date, Sales Results from various time periods, and a rollup for sales in number of deals (Total Sales) and the dollar amount for sales (Fiscal Year).
This is the information we are giving. However, we can add new information to our dataset by adding new columns and aggregations.
What are some obvious questions that we should try to answer? The first thing that comes to mind for me is which salespeople have the highest sales results compared to their peers across the company and in their location? There are other things to consider as well like what are the sales numbers per location.
Let us add some quick summaries that Excel has built-in for data in tables. We are going to add row total summaries using the Table Design tab in Excel.

Note, we will have to click the drop-down arrow at the bottom of the table to choose our aggregation method.

Once we click the arrow, we have the following choices.

Once complete, the values will be summarized on the bottom row of the table after we select which aggregation. We can do this for any column as needed. I am going to start by adding sums to each column for sales data.

We now have company-wide sales results for employee by quarter and year. We can see from this summary that each quarter made at least $1,000,000 with at least 700 sales. The Total Sales for the year were 3039 deals bringing in $5,163,992. This is nice being able to quickly see these results. However, let us dive deeper into our analysis.
A quick way to visually see our top sales performers is using conditional formatting with color. The company wants to give an incentive as well for salespeople that have over $75,000 for the Fiscal Year. We can do this with built-in Excel tools.
In the Home tab, we will use the Conditional Formatting button.

We are going to select Highlight Cells Rules with the greater than condition applied.


We can now filter in our table by color to only show the salespeople with greater than $75,000 by using the drop-down arrows in our table.

Here is the result of our sort.

Notice the rollup values also are filtered, so we can see the Total Sales results from our top performers. We can also quickly capture the Employee IDs as well to forward to the correct departments for the incentives added to their pay.
We can also do the same procedure to identify our lowest performers in another color to help with coaching. I highlighted the sales values lower than $55,000 in yellow to add additional values for comparisons.

Note, when performing data analysis, there will be sometimes where there is no direct approach to find the results you are after. Often, you have sparks of creativity and inspiration while you are working with the data. This is often called Exploratory Data Analysis. Having said this, I added a new column to our data set dividing the Fiscal Year values by the Total Sales values to see the average dollar amount per sales deal. I do not know if this is needed moving forward, but it was a quick, easy item to add.

I now want to use this information to find the 10% of this average we created with Excel conditional formatting like below.

Here are the results.

We now have a nice understanding of our top and bottom performers with some quick data analysis techniques. Now we will move on to compare location sales results with a Pivot Table to better understand our data.
Click inside your table, and then insert a Pivot Table in a new worksheet.


A new Worksheet will open with your Pivot Table shell.

I pulled in Location in the rows section of the PivotTable Field pane, and I pulled in Total Sales and Fiscal Year in the Values section. Notice, Excel pre-selected sum as the aggregation method here. We could update the aggregation as need, but sum works for us.

Just by adding in this quick Pivot Table, we have answered our question from earlier regarding how well each location is performing compared to each other.
Our Pivot Table clearly shows which location is top and bottom for sales results.

As we can see, we can use this data from our analysis to try to uncover the “why” for these results. Can we improve our sales by identifying top performers? Can these top performers help coach/mentor lower performing salespeople? Why is the West location leading the way in numbers? Why does the North location only have 430 Total Sales verses the West Location with 836?
There is also data available for Hire Date in our data set. Can we add this factor in our results or discussion on how to improve our numbers from tenured vs non-tenured employees?
A common misconception is that when we do “X” data analysis technique is that we will have a clear answer to a question. Often this is not the case. We need to perform more analysis or an “analysis of an analysis” to discover solutions to our business problems.
Take these techniques I have shown and add them to your toolkit. Maybe there are other techniques you can think of to answer questions with data. That is the beauty—explore your data as you see fit.


Comments